Step-by-step guide to using
google analytics for SEO optimization

What is google analytics?

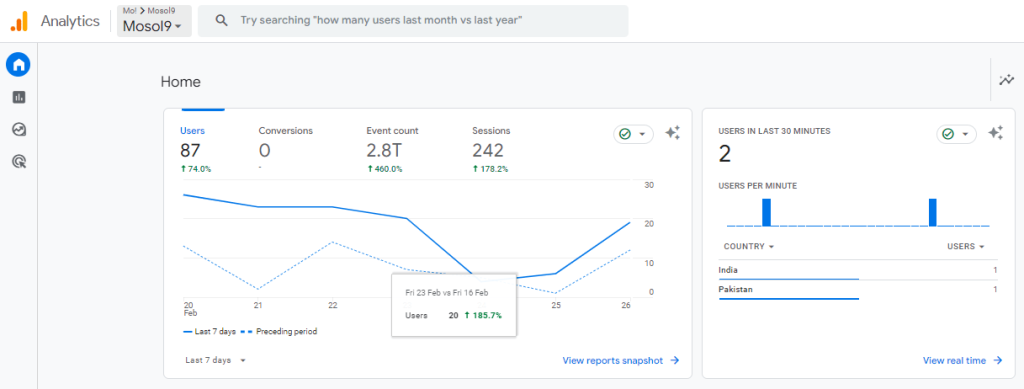
Google analytics is a web analytics service that tracks and reports website traffic, providing insights into user behavior, demographics, and acquisition channels. It helps website owners understand their audience, optimize marketing strategies, and improve overall website performance.
How google analytics works?

Google analytics is a web analytics service that tracks and reports website traffic, providing insights into user behavior, demographics, and acquisition channels. It helps website owners understand their audience, optimize marketing strategies, and improve overall website performance.

Google analytics works by collecting data from websites or mobile apps and providing insights into user behavior, website performance, and marketing effectiveness. Here’s how it works:

When a user visits a website or interacts with a mobile app, a small piece of code called the Google analytics tracking code is executed. This code, provided by Google analytics, is typically added to every page of the website or integrated into the app.

Once the tracking code is executed, it sends information about the user’s interaction to the Google analytics servers. This information includes data such as the user’s IP address, browser type, device type, pages visited, actions taken (such as clicks or form submissions), and referral source.

Google analytics then processes this data and organizes it into reports, which users can access through the Google analytics interface. These reports provide valuable insights into various aspects of website or app performance, such as traffic sources, user demographics, user behavior, conversion rates, and more.
Users can customize their google analytics setup by setting goals, defining segments, and configuring filters to focus on specific metrics or segments of their audience.

Overall, google analytics helps website owners, marketers, and app developers make data-driven decisions to optimize their online presence, improve user experience, and achieve their business goals. By understanding how users interact with their websites or apps, they can identify areas for improvement, track the effectiveness of marketing campaigns, and make informed decisions to drive growth and success.

What Is GA4

GA4, which stands for google analytics 4, is the latest version of Google’s analytics platform. It offers advanced features and insights for tracking and analyzing website and app data, helping businesses understand user behavior, optimize marketing strategies, and improve overall performance. GA4 provides a more streamlined and event-based approach to data collection compared to previous versions, allowing for better tracking of user interactions across platforms and devices.

Google analytics metrics

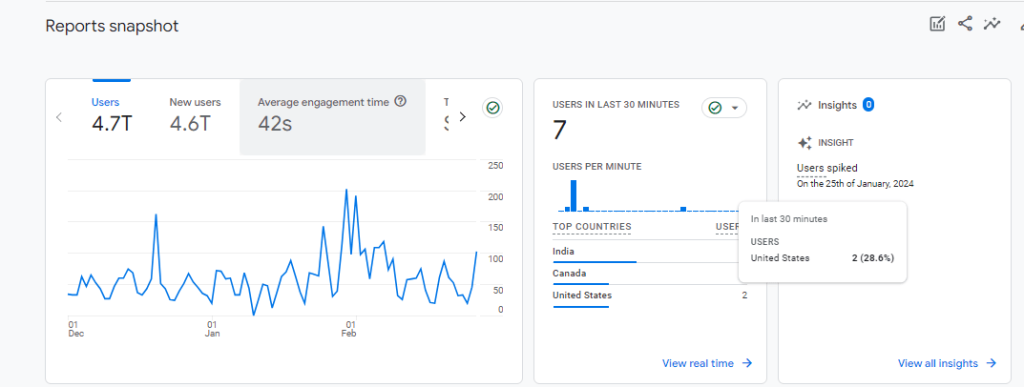
Metrics in Google analytics are the quantitative measurements or data points that provide insights into various aspects of website or app performance. These metrics help in understanding user behavior, engagement, conversions, and other key performance indicators (KPIs). Here are some essential metrics commonly tracked in Google analytics:
  • Sessions refer to the interactions users have with your website within a specified time frame. It starts when a user lands on your site and ends after a period of inactivity or when the user leaves.
  • Understanding the number of sessions can help you gauge the overall traffic volume to your website.
  • leaves.
  • Tracking trends in sessions over time can indicate whether your marketing efforts are effective in driving traffic to your site.

Users:

    • Users represent the number of distinct individuals who visited your website within a specific time period.
    • This metric provides insights into the size of your audience and helps in understanding unique visitor behavior.
    • By comparing users to sessions, you can determine how often users are returning to your site.
Pageviews:
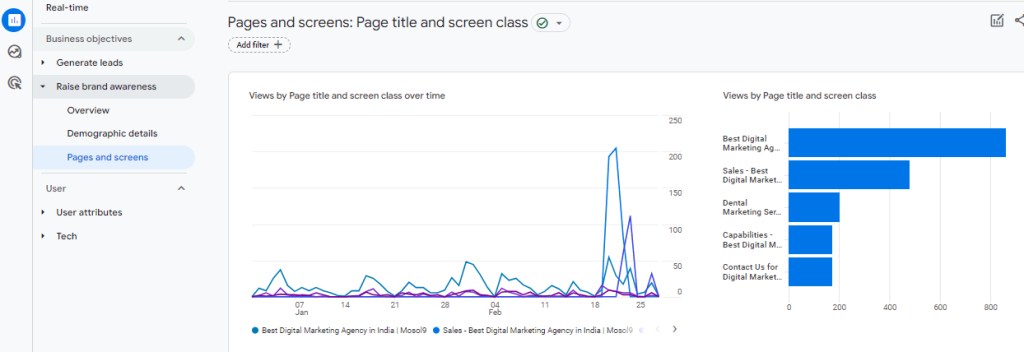
    • Pageviews indicate the total number of pages viewed by users on your website.
    • It includes repeated views of a single page by the same user.
    • Tracking pageviews helps in understanding which pages are most popular or engaging for your audience.
Average session duration:
    • Average session duration measures the average amount of time users spend on your site during a session.
    • Longer average session durations often indicate higher engagement and interest in your content.
    • Analyzing session duration can help in identifying engaging content or areas where users may be dropping off quickly.
Bounce rate:
    • Bounce rate represents the percentage of single-page visits where the user leaves your site without interacting further.
    • Lowering the bounce rate typically involves improving the user experience and ensuring that landing pages align with user expectations.
    • Analyzing session duration can help in identifying engaging content or areas where users may be dropping off quickly.
Conversion rate:
    • Conversion rate measures the percentage of users who complete a desired action, such as making a purchase, filling out a form, or signing up for a newsletter.
    • Improving conversion rates often involves optimizing landing pages, calls-to-action, and the overall user journey.
    • Analyzing session duration can help in identifying engaging content or areas where users may be dropping off quickly.
Goal completions:
    • Goal completions represent the number of times users complete specific goals on your site, such as reaching a particular page, spending a certain amount of time on the site, or filling out a form.
    • Setting up and tracking goals allows you to measure the success of your website in fulfilling predetermined objectives.
    • Analyzing goal completions can help in identifying areas for improvement and optimizing the user experience.
Revenue:
    • Revenue indicates the total monetary value generated from conversions on your website.
    • It provides insights into the financial performance of your online business and the effectiveness of your marketing efforts.
    • Tracking revenue allows you to measure ROI and allocate resources more effectively.
Acquisition channels:
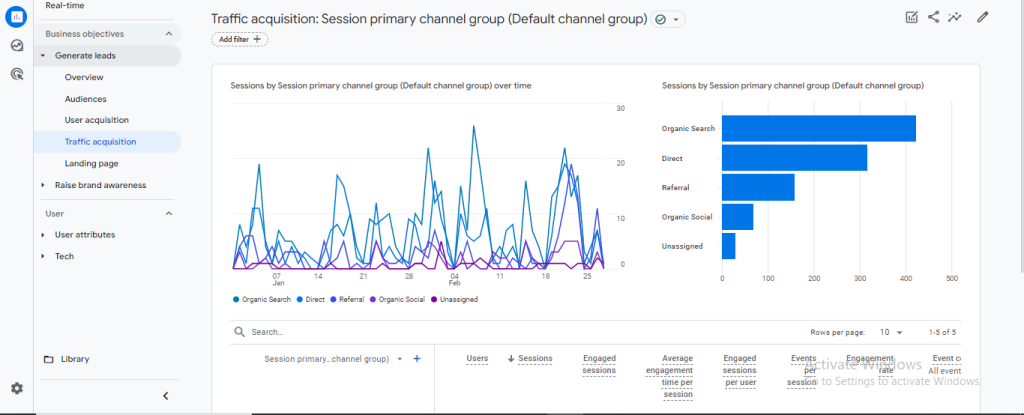
    • Acquisition channels refer to the sources through which users land on your website, such as organic search, direct traffic, referral traffic, social media, or paid advertising.
    • Understanding acquisition channels helps in identifying the most effective marketing channels for driving traffic and conversions.
    • By optimizing your marketing strategies for high-performing channels, you can improve overall campaign performance.
Traffic sources:
What is google analytics?
    • Traffic sources provide information about the specific websites, search engines, or campaigns that refer traffic to your site.
    • Analyzing traffic sources helps in understanding where your visitors are coming from and which channels are driving the most traffic.
    • By focusing on high-performing traffic sources, you can optimize your marketing efforts and allocate resources more efficiently. These metrics are fundamental for understanding user behavior, optimizing website performance, and achieving your business objectives in the digital space. Regular monitoring and analysis of these metrics in Google Analytics can provide valuable insights for improving your online presence and driving business growth.
We build and launch functional digital products
We build digital products
×